Ecological site group G058CY500ND1
Overflow Forage Suitability Group EXAMPLE
Last updated: 03/07/2025
Accessed: 05/10/2025
Ecological site group description
Key Characteristics
None specified
Physiography
The soils in the Overflow group are on flood plains, alluvial fans and stream terraces.
Minimum Maximum
Elevation (feet): 2000 3300
Slope (percent): 0 6
Flooding:
Frequency: Occasional Frequent
Duration: Brief Brief
Ponding:
Depth (inches):
Frequency: None None
Duration: None None
Runoff Class: Negligible Low
Climate
This group occurs in a mid-continental climate characterized by wide seasonal temperature and precipitation fluctuations and extremes.
Annual precipitation varies widely from year to year in MLRA 58C. Average annual precipitation for all climate stations listed below is about 15 inches. About 77 percent of that occurs during the months of April through September. On average there are about 32 days with greater than .1 inches of precipitation during the same time period. Precipitation is less than needed for optimum forage production and is the single largest factor limiting
production from this group on non-irrigated lands.
Average annual snowfall ranges from 23 inches at Amidon, ND to 39 inches at Dunn Center, ND. Days with soil insulating snow cover at depths greater than 1 inch range from 27 at Amidon to days at Trotters, ND.
Average July temperatures are about 70 degrees F., and average January temperatures are about 13 degrees F. Recorded temperature extremes in the MLRA during the years 1961 to 1990 are a low of -43 at Keene, and a high of 110 at Trotters. The average dates of last and first frost (32 deg) for the listed stations are May 16 and September 17 for an average frost free period of 125 days. The MLRA lies in USDA Plant Hardiness Zones 3b and 4a.
At Williston, ND, the closest station with records, the average annual wind speeds are about 10 MPH. The highest wind speeds occur during March through June, but average monthly wind speeds do not vary significantly throughout the year. It is cloudy about 160 days a year with the lowest incidence of cloudiness occurring during the summer months. Average morning relative humidity in June is about 81 percent and average afternoon humidity is 54 percent.
The climate data listed in the tables below represent high and low ranges and averages for the climate stations and dates listed. For additional climate data access the National Water and Climate Center at http://www.wcc.nrcs.usda.gov.
From To
Freeze-free period (28 deg)(days): 116 130
(9 years in 10 at least)
Last Killing Freeze in Spring (28 deg): Jun 03 May 17
(1 year in 10 later than)
Last Frost in Spring (32 deg): Jun 16 May 29
(1 year in 10 later than)
First Frost in Fall (32 deg): Aug 20 Sep 07
(1 year in 10 earlier than)
First Killing Freeze in Fall (28 deg): Sep 02 Sep 18
(1 year in 10 earlier than)
Length of Growing Season (32 deg)(days): 90 112
(9 years in 10 at least)
Growing Degree Days (40 deg): 3722 4311
Growing Degree Days (50 deg): 2004 2440
Annual Minimum Temperature: -25 -35
Mean annual precipitation (inches): 15 16
Monthly precipitation (inches) and temperature (F):
2 years in 10: Jan Feb Mar Apr May Jun Jul Aug Sep Oct Nov Dec
Precip. Less Than 0.12 0.11 0.22 0.38 0.91 1.74 0.92 0.57 0.46 0.29 0.18 0.14
Precip. More Than 0.56 0.57 0.93 2.24 3.53 4.22 3.20 2.49 2.39 1.72 0.91 0.60
Monthly Average: 0.36 0.37 0.60 1.32 2.22 3.02 2.19 1.55 1.55 1.17 0.59 0.37
Jan Feb Mar Apr May Jun Jul Aug Sep Oct Nov Dec
Temp. Min. 2.6 10.1 19.2 30.3 41.8 50.7 55.5 54.0 43.3 32.3 18.4 7.0
Temp. Max. 24.0 31.4 42.0 56.5 68.7 77.5 84.4 84.3 72.3 58.7 39.1 28.1
Temp. Avg. 13.3 20.7 30.6 43.4 55.3 64.1 69.9 69.2 57.8 45.5 28.7 17.5
Climate Station Location From To
ND 4571 Keene, ND 1971 2000
ND9246 Watford City 14 S, ND 1971 2000
ND2365 Dunn Center 2 S, ND 1971 2000
ND2809 Fairfield, ND 1971 2000
ND5813 Medora, ND 1971 2000
ND8812 Trotters 3 SSE, ND 1971 2000
ND0209 Amidon, ND 1971 2000
Soil features
This group consists of very deep, well drained, medium textured soils formed in alluvium. Permeability is moderate, and available water holding capacity is high.
Drainage Class: Well drained To Well drained
Permeability Class: Moderate To Moderate
(0 - 40 inches)
Frost Action Class: Moderate To Moderate
Minimum Maximum
Depth: 72 0
Surface Fragments >3" (% Cover):
Organic Matter (percent): 0.5 4.0
(surface layer)
Electrical Conductivity (mmhos/cm): 0 2
(0 - 24 inches)
Sodium Absorption Ratio: 0 0
(0 - 12 inches)
Soil Reaction (1:1) Water (pH): 6.6 8.4
(0 - 12 inches)
Available Water Capacity (inches): 10 11
(0 - 60 inches)
Calcium Carbonate Equivalent (percent): 0 10
(0 - 12 inches)
Soil Limitations
These soils have few limitations to the production of climatically adapted forage crops. Production potential is high. Flooding is a potential hazard. Also, all of these soils receive additional moisture, so the potential exists for soil compaction from grazing or operating machinery on them when wet.
Vegetation dynamics
Management Interpretations
Soils in this group that are subject to flooding can have forage production adversely impacted if it occurs during the spring or growing season. Flooding duration, or the time period plants are under water is more important than flooding frequency for the survival of forage crops. If these soils flood it is generally for only a brief time. Exclude livestock and machinery during extended periods of soil wetness to reduce soil compaction. When
establishing new stands or renovating stands select species and varieties that can make best use of the additional soil moisture this group receives.
Pasture and hayland can include considerations for wildlife. Delaying grazing on portions of the pasture or rotating pastures will allow nest initiation of grassland nesting birds or species of concern. Nest initiation of most grassland nesting birds occurs from April 15 to June 1. Delaying haying until after July 15 allows for most species to fledge their young. Consider planting species with later maturity to allow for harvesting after nests have fledged. Avoid mowing around the field. Mow back and forth or from the inside to the outside of the field. Consider using flushing bars on swathers and mowers.
Production Estimates
Production estimates listed here should only be used for making general management recommendations. On site production information should always be used for making detailed planning and management recommendations.
The high forage production estimates listed below are based on dense, vigorous stands of climatically adapted, superior performing cultivars. They are properly fertilized for high yields, and pest infestations are kept below economic thresholds. Mechanical harvests are managed to maintain stand life by cutting at appropriate stages of maturity and harvest intervals. If grazed, optimum beginning and ending grazing heights are adhered to. Adequate time is allowed for plant recovery before entering winter dormancy under both uses.
FSG Documentation
Similar FSGs:
FSG ID FSG Narrative
G058CY100ND Loamy soils do not receive the additional water and are less productive.
Inventory Data References:
• Agriculture Handbook 296-Land Resource Regions and Major Land Resource Areas
• Natural Resources Conservation Service (NRCS) National Water and Climate Center data
• USDA Plant Hardiness Zone Maps
• National Soil Survey Information System (NASIS) for soil surveys in North Dakota counties in MLRA 58C
• North Dakota NRCS Field Office Technical Guides
• NRCS National Range and Pasture Handbook
• Various Agricultural Research Service, Cooperative Extension Service, and NRCS research trials for plant adaptation and production.
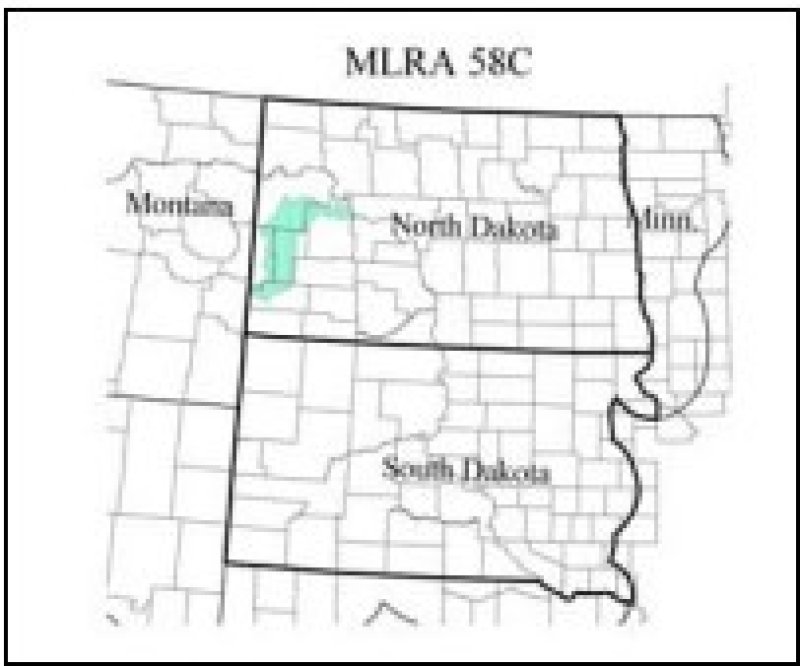
Major Land Resource Area
MLRA 058C
Northern Rolling High Plains, Northeastern Part
Subclasses
Correlated Map Unit Components
25778304, 25778307, 25778383, 25815623
Stage
Approved
Contributors
Tim Nordquist, Original Author 10/15/2020
Jeff Printz, Approved 03/2005
Click on box and path labels to scroll to the respective text.